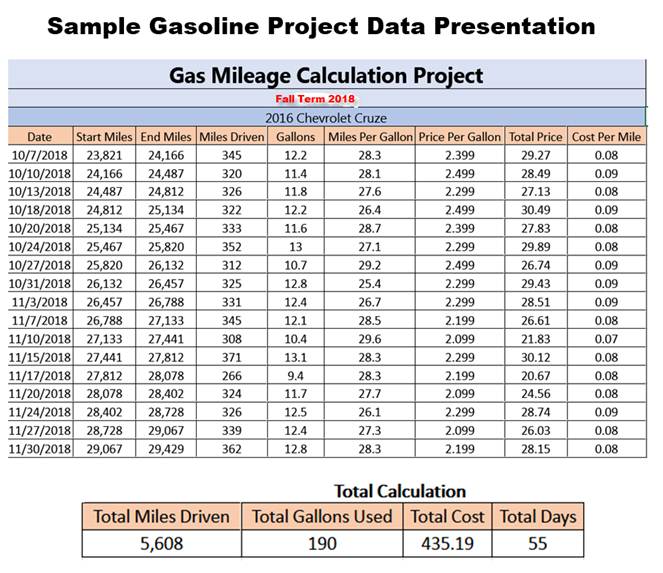
The student above did a nice job, good data
collected, good presentation (slightly different from what I outline) and the
totals make sense.
The student filled up every purchase
(not necessary). But I have questions about the first line.
Did he/she start the project October 7
or before.
Did he/she use the initial fillup and
cost in the total gallons and total cost?
The student earned 40 points out of 50 as she/he did not due the projections
not the carbon dioxide emmissions.
Even though there is a question about the data he/she earned 38/40 for doing a
good job.
Second Sample Gasoline
Project Fall 2018
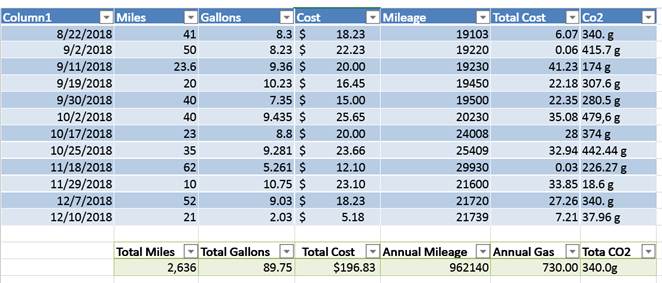
The above data just does not make sense.
The student should have discussed this data before sending in the final project.
The student earned 30 points for data
collection; but lost 10 points for the calculation and presentation.
The student earned 2 points out of 10 for the two projections.
Grade Total 32/50.
Third Sample Gasoline
Project Fall 2018

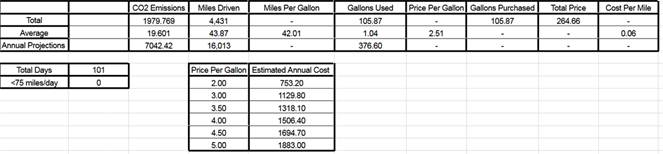
This third project is excellent, the data is
collected & presented.
The first line is not used in the
totals.
The calculations and projects make sense.
Grade 50/50