CHM 1020
Project #2: Measurement via Gasoline Project
Calculations/Projections/Research
Conclusions (5 points):
What is your annual mileage?
(Annual
Mileage = your daily average miles driven calculated above
multiplied by 365 days)
What is your projected annual
need for gasoline?:
(Annual Gasoline Demand: Your average
Gallons Used multiplied by 365 days)
What will be annual cost at
$2.00 per gallon; $2.50 per gallon, $3.00 per gallon; $3.50 per gallon; $4.00
per gallon; $4.50 per gallon; and $5.00 per gallon?
(Annual
Cost @ $2.00/gallon = Yearly Gasoline Demand(gallons)
multiplied by $2.00/gallon)
(Annual
Cost @ $2.50/gallon = Yearly Gasoline Demand(gallons)
multiplied by $2.50/gallon)
(Annual
Cost @ $3.00/gallon = Yearly Gasoline Demand(gallons)
multiplied by $3.00/gallon)
(Annual
Cost @ $3.50/gallon = Yearly Gasoline Demand(gallons)
multiplied by $3.50/gallon)
(Annual
Cost @ $4.00/gallon = Yearly Gasoline Demand(gallons)
multiplied by $4.00/gallon)
(Annual
Cost @ $4.50/gallon = Yearly Gasoline Demand(gallons)
multiplied by $4.50/gallon)
(Annual
Cost @ $5.00/gallon = Yearly Gasoline Demand(gallons)
multiplied by $5.00/gallon)
Total
Pounds of Carbon Dioxide released into the atmosphere by you every year?
(Total
Annual CO2 Released = Total Annual Gallons Used multiplied by 18.7
pounds/gallon)
If everyone is like you,
calculate Total Gallons Used by 225,000,000 U.S. Cars per year!
The instructor may add
additional data for you to determine to complete this project.
Research
the Internet. And see if you can find additional information which follows: .
In 2015 the EIA (United State Energy
Administration) reported:
How much
gasoline does the United States consume?
In 2015, about 140.43 billion
gallons (or about 3.34 billion barrels1) of gasoline were consumed2
in the United States, a daily average of about 384.74 million gallons (or about
9.16 million barrels per day).3 This was about 1.5% less than the
record high of about 390 million gallons per day (or
about 9.29 million barrels per day) consumed in 2007.
1
There
are 42 U.S. gallons in a barrel.
2 EIA uses product supplied to represent approximate
consumption of petroleum products. Product supplied measures the disappearance
of these products from primary sources, such as refineries, natural gas
processing plants, blending plants, pipelines, and bulk terminals.
3 Preliminary data for 2015.
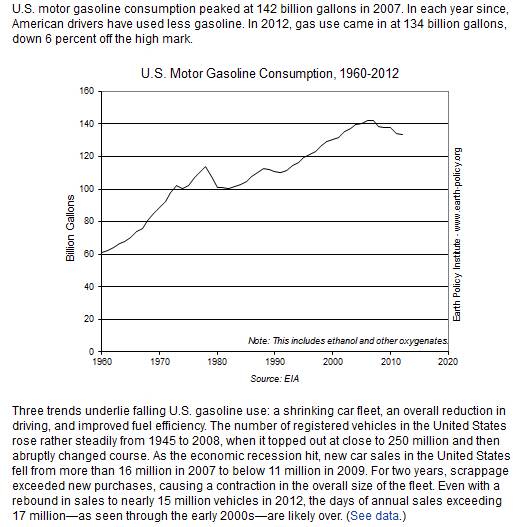
We Are Using Less Gasoline Today
If you do not
drive or own a vehicle and can not get cooperation
from your family, the instructor will assigned an alternate energy demand project(My Electric Demand!) or you may earn 20 total points
using the data of your instructor’s car (4 years).
Write a summary/Conclusions and statement of what you learned from this project
(one paragraph)
U.S. Total Gasoline Retail Sales
by Refiners (Thousand Gallons per Day)
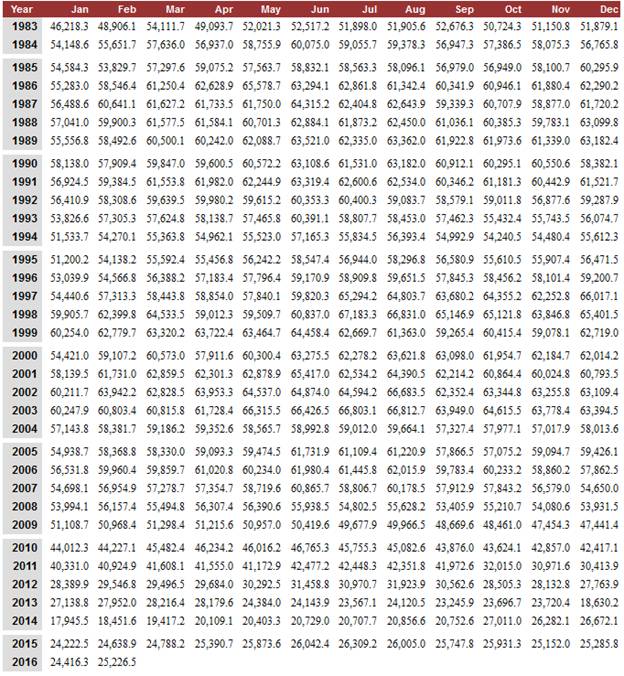
In you Summary paper, the data above states we are doing
better conserving our gasoline while more cars are on the road and the price for
the last year or two has dropped 50%! Why? (include a
paragraph)
Average U.S. gasoline usage lowest in 3 decades, study says (Automotive News March 2015)
With improvements in vehicle fuel
economy, U.S. drivers’ average gasoline consumption is the lowest it’s been in
at least 30 years, according to research by the University of Michigan released
today.
The number of gallons of gasoline
used per person, driver, vehicle and household is below rates in 1984, when the
study was first conducted, according to researcher Michael Sivak
of the University of Michigan Transportation Research Institute.
In 2013, gallons of gasoline
consumed per person (392) fell 17 percent from 2004, gallons used per driver
(583) fell 16 percent, and gallons used per household (1,011) fell 19 percent.
2004 was the year of maximum consumption for those categories.
Gallons used per vehicle (524)
dipped 14 percent from 2003, which was its maximum consumption year.
Even though population grew 8
percent from 2004 to 2013, total fuel consumed by light vehicles decreased 11
percent, Sivak said in a statement.
In 1984, annual fuel consumption
rates were slightly higher than in 2013: 400 gallons per person, 608 gallons
per driver, 602 gallons per vehicle and 1,106 gallons per household.
The study also found that the number
of vehicles and distance driven per person, driver, vehicle and household are
at their lowest since the 1990s, the statement said.
The declining number is driven not
only by economic factors, but also rises in telecommuting and use of public
transportation, Sivak said.
“The reductions in the
fuel-consumption rates reflect, in part, the added contribution of the
improvements in vehicle fuel economy,” he said in a news release.
“Per person, per driver and per
household -- we now have fewer light-duty vehicles, we drive each of them less
and we consume less fuel than in the past,” Sivak
added.
Sivak and fellow researcher Brandon Schoettle
also compile an average fuel economy report each month.