CHM 1020/CHM 1025C/CHM1032C/CHM2045C
Project/Lab #2: Measurement via Gasoline Project
Assignment & Data
Collection/Presentation:
In
Chemistry we collect data in the laboratory while performing an experiment.
Our second project concerns measurement and data collection in the field (CHM
1020 has no lab component).
As an experiment/lab, you can do from the 1st week to the last, we
can find out what your energy consumption and cost are for driving a car.
Here is the project which we will start ASAP and finish the last week of the
term.
Data
Collection (A15/B12: 10-15 weeks) (A7: 5-7weeks)
During the first weeks of class you need to fill your gasoline tank in your
car*.
During the course, you will keep a record of all purchases
of gasoline noting dates, price, amount, cost and
odometer reading.
Get receipts and/or keep a
diary in your vehicle. It is not necessary to submit the receipts with your
project.
If you share the car, make certain the other person(s) get receipts for any
gasoline purchases they might do during the term of the project.
It is not necessary to fill your tank with each purchase, just the first to
start, and then the last to complete the project.
Collecting the data is worth 10 points to 30 points, depending on the number of
weeks of the project:
A - 7: 5 weeks minimum;
B-12: 10 weeks minimum; and
A-15: 12 weeks minimum.
Data Presentation: The Final week
After filling your tank the
last week, transfer each purchase to a data page table or in a spreadsheet.
Presenting the data collected in spread sheet format or WORD table is worth (5
Points), Correctly summing your project totals:
Total
#days, Total #miles, Total #gallons, Total #cost (5 Points).
If you do not have the software, a handwritten table will be OK.
Summary of the data Collected
Some students have a hard time making the calculations to arrive at your totals.
Some students used an online excel
spreadsheet from the Internet to record and present gasoline demand.
..but several of the calculations were ridiculous, like 11,000 miles per
gallon; cost 0 cents per mile..
.Many of you have the problem of NOT having number sense. A few students from a
previous term had no problem driving a total 292 miles and averaging 12,500
miles per gallon????
If you have never programmed a
spreadsheet, maybe you do it the old fashion way with a calculator as described
below:
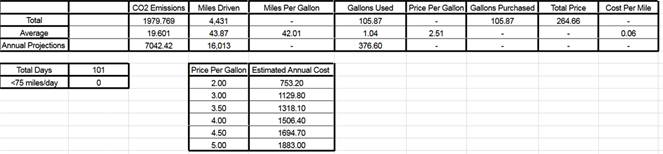
During the last week, after you fill your tank to finish the project, you will determine:
- The Total Miles driven; the Total Gallons Used; the Total Cost; and the Total Days of the Project.
Total Miles
Driven:
Subtract your
initial odometer reading from your final Odometer Reading
Total gallon
Used:
Sum all your
Gallons Purchased, except do not include the gallons recorded in your initial
fill-up (Why?)
Total Cost:
Sum all your
dollars spent during the project, except the initial fill-up. (Why?)
Total
Days:
Use a
calendar and count the number of days from the first fill-up to the last fill-up.
(For example: September 3 to December 14 is 27 days in Sept; 31 day in October,
30 days in November, and 14 days in December which totals 102 Days)
- Then you will compute the average MPG and the average cost per mile for the gasoline.
MPG = Total Miles Driven divided by Total Gallons Used
Average Cost Per Mile = Total Dollars Spent divided by Total Mile Driven
- You will also calculate your average daily mileage and your average daily gallons of gasoline used:
Average daily Miles = Total Miles Driven divided by Total Days of the Project
Average Daily Gallons Used = Total Gallons Used divided by Total Days of the Project
- How many times did you exceed 75 miles in one day?
(You may not be
able to answer this. During the project, how many times did you go on a trip?
My daughter lives in Holiday, FL with my two granddaughters. That is 251 miles
each way. One or two trips to Holiday for me would skew my average daily
miles.)
Statistics say
that the average U.S. driver averages 29 miles per day-and this can be skewed
if you took a long trip during the project to see if you are average.
(For me, I live on the Southside and work at North campus, which is 30.9 miles
from door to door. Just to go to work I drive 62 miles per day just to go to and
from work. I am not the average driver.) Are you?
Projections
of the Data Collected/Calculated
The last part of the project is for you to do the annual projections and summary of CO2 emissions. This is worth 10 points.
- What is your annual mileage?
Annual Mileage = your daily average miles driven calculated above multiplied by 365 days in a year
- What is your projected annual need for gasoline?
Annual Gasoline Demand = Your average daily Gallons Used multiplied by 365 days in a year
- What would be your annual cost at $2.00 per gallon; $3.00 per gallon; $3.50 per gallon; $4.00 per gallon; $4.50 per gallon; and $5.00 per gallon.
Annual Cost @ $2.00/gallon = Yearly Gasoline Demand(gallons) multiplied by $2.00/gallon
Annual Cost @ $3.00/gallon = Yearly Gasoline Demand(gallons) multiplied by $3.00/gallon
Annual Cost @ $3.50/gallon = Yearly Gasoline Demand(gallons) multiplied by $3.50/gallon
Annual Cost @ $4.00/gallon = Yearly Gasoline Demand(gallons) multiplied by $4.00/gallon
Annual Cost @ $4.50/gallon = Yearly Gasoline Demand(gallons) multiplied by $4.50/gallon
Annual Cost @ $5.00/gallon = Yearly Gasoline Demand(gallons) multiplied by $5.00/gallon
- Total Pounds of Carbon Dioxide released into the atmosphere by you every year.
Total Annual CO2 Released = Total Annual Gallons Used multiplied by 18.7 pounds/gallon
This experiment is equivalent
to four small projects (two wet chemistry labs) as it is an intense A-15/B-12: 10-14
week exercise in data collection
or an intense A-7: 5-7 weeks exercise in data collection for 20-60
points depending on the number of weeks data is collected.
(If you have two cars, you may
do two projects. The second car will earn extra credit.
Then you may compare the efficiency or lack of for your fleet of autos. If you
change cars during the project, you have to make some estimations-talk with
your instructor how to switch cars during the project and maintain the accuracy
of the project
Although it will be interesting to see if there is a difference between the two
vehicles, it still counts as only one project. Maybe a little extra credit for presentation.
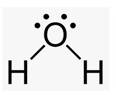
The chemical reaction for combusting gasoline is:
2 C8H18 (l) + 25 O2 (g) à 16 CO2 (g) + 18 H2O (g)
Octane burns in oxygen gas to form carbon dioxide and water as products ,which comes out your tailpipe
|
|
+ |
|
à |
|
+ |
|

(Burn 1 gallon put 18.7 Lbs CO2 in the environment!)
In CHM 1025C & CHM 1020 Chapter 9 introduces Mass Stoichiometry.
(In CHM 2045C Chapter 3 begin stoichiometry)
We
will prove the 18.7 lb CO2/gallon statement when we study chemical
reactions and mass stoichiometry in Chapter 9.
Do not worry about this Calculation until we get to chapter 9 Section 9.2
Show a dimensional analysis setup in your project to prove this in the conclusion of your project.
Unit Factors Needed: 3.79L = 1
Gal 0.680g C8H18 = 1L 453.56g = 1 lb 1 L = 1000 mL
2.205lb = 1kg 1000g = 1kg 114gC8H18
= 1 moleC8H18 44.0g CO2 = 1 mole CO2
*You need to only fill the tank twice, at the beginning and at the end of the
project. You will not use the first fill-up in your calculations, except
odometer reading. Why?
The instructor may add
additional data for you to determine to complete this project after studying chapter
9.
If you do not drive or own a vehicle and can not get cooperation from your family, the instructor will be assigned an alternate energy demand project (My Electric Demand!) or you may earn partial credit using the data of your instructor’s car (4 years instead of 2-5 months).
Project Conclusion/Summary
Write a summary/Conclusions and statement of what you learned from this project
(at least one paragraph).
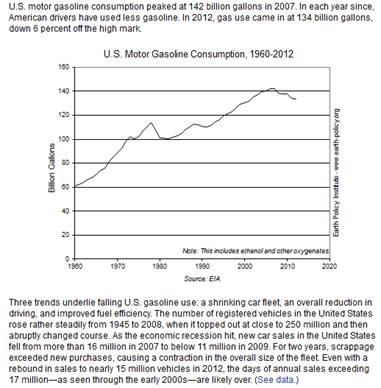
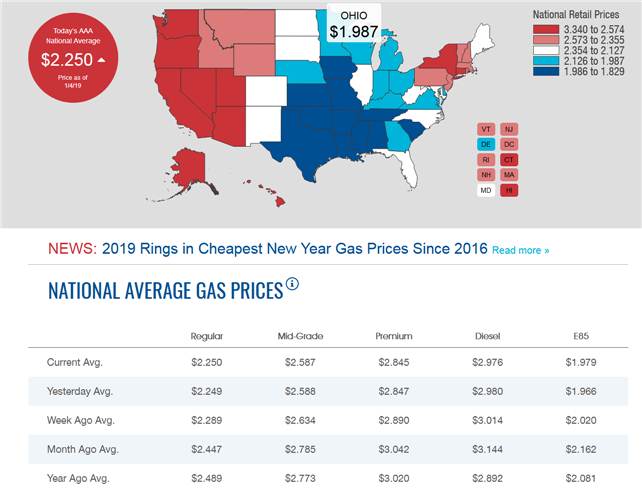
In your Summary paper, the data above and below states we are doing better
conserving our gasoline while more cars are on the road and the price for the
last year or two has dropped 50%! Why? (include a paragraph)
Research the Internet. And see
if you can find additional information.
I
found the following:
In 2015 the EIA
(United State Energy Administration) reported:
How much gasoline does the United States consume?
In
2015, about 140.43 billion gallons (or about 3.34 billion barrels1)
of gasoline were consumed2 in the United States, a daily average of
about 384.74 million gallons (or about 9.16 million barrels per day).3
This was about 1.5% less than the record high of about 390 million gallons per day (or about 9.29
million barrels per day) consumed in 2007.
1 There are 42 U.S.
gallons in a barrel.
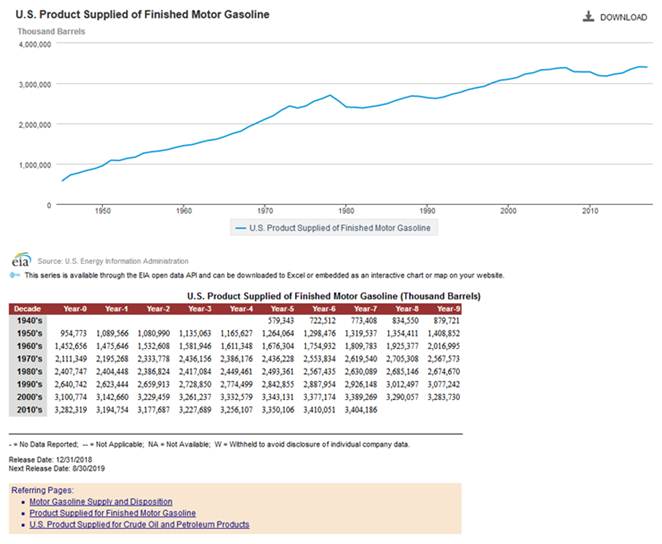
2 EIA uses product supplied to represent approximate
consumption of petroleum products. Product supplied measures the disappearance
of these products from primary sources, such as refineries, natural gas
processing plants, blending plants, pipelines, and bulk terminals.
3 Preliminary data for 2015.
We Are Using Less Gasoline Today
U.S. Total Gasoline Retail Sales by Refiners (Thousand Gallons per Day)
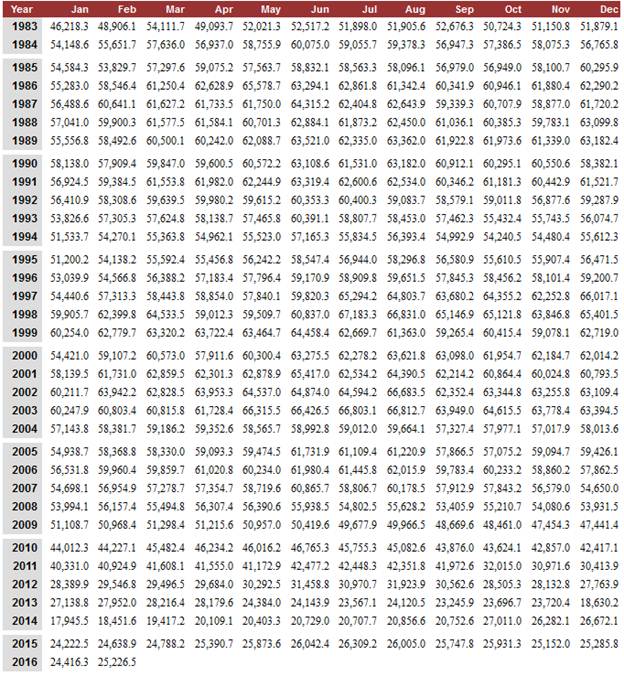
Update of Gasoline Usage in the United States
URL: https://www.eia.gov/dnav/pet/hist/LeafHandler.ashx?n=PET&s=MGFUPUS1&f=A
Average U.S. gasoline usage lowest in 3 decades, study says (Automotive News March 2015)
With improvements in vehicle fuel economy, U.S. drivers’ average gasoline
consumption is the lowest it’s been in at least 30 years, according to research
by the University of Michigan released today.
The number of gallons of gasoline used per person, driver, vehicle and household is below rates in 1984, when the study was first conducted, according to researcher Michael Sivak of the University of Michigan Transportation Research Institute.
In 2013, gallons of gasoline consumed per person (392) fell 17 percent from 2004, gallons used per driver (583) fell 16 percent, and gallons used per household (1,011) fell 19 percent. 2004 was the year of maximum consumption for those categories.
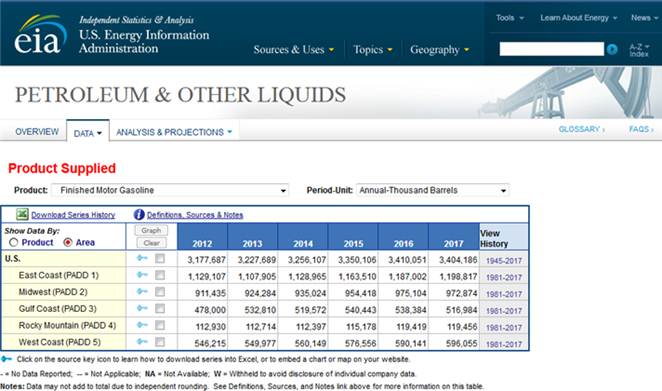
URL: https://www.eia.gov/dnav/pet/pet_cons_psup_a_EPM0F_VPP_mbbl_a.htm
Article Continues:
Gallons used per vehicle (524) dipped 14 percent from 2003, which was its maximum consumption year.
Even though population grew 8 percent from 2004 to 2013, total fuel consumed by light vehicles decreased 11 percent, Sivak said in a statement.
In 1984, annual fuel consumption rates were slightly higher than in 2013: 400 gallons per person, 608 gallons per driver, 602 gallons per vehicle and 1,106 gallons per household.
The study also found that the number of vehicles and distance driven per person, driver, vehicle and household are at their lowest since the 1990s, the statement said.
The declining number is driven not only by economic factors, but also rises in telecommuting and use of public transportation, Sivak said.
“The reductions in the fuel-consumption rates reflect, in part, the added contribution of the improvements in vehicle fuel economy,” he said in a news release.
“Per person, per driver and per household -- we now have fewer light-duty vehicles, we drive each of them less and we consume less fuel than in the past,” Sivak added.
Sivak and fellow researcher Brandon Schoettle also compile an average fuel economy report each month.
Why
do we not add the # gallons and Total Spent
on the initial fill-up in the Project Totals at the
bottom of your data presentation?
How
do we determine the #days in the project?
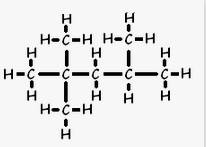
One of the Octane
Molecules we will study in Chapter 12
 2,2,4
Trimethylpentane
2,2,4
Trimethylpentane
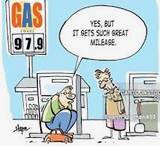
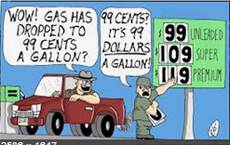
What
does this octane rating mean?
In
your project conclusion describe what the octane rating means and what octane
you use in your vehicle.
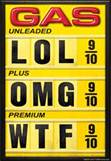
Premium:
91-93 Octane
Midgrade: 89 octane Regular: 87
octane
Can you buy 100 octane gasoline?
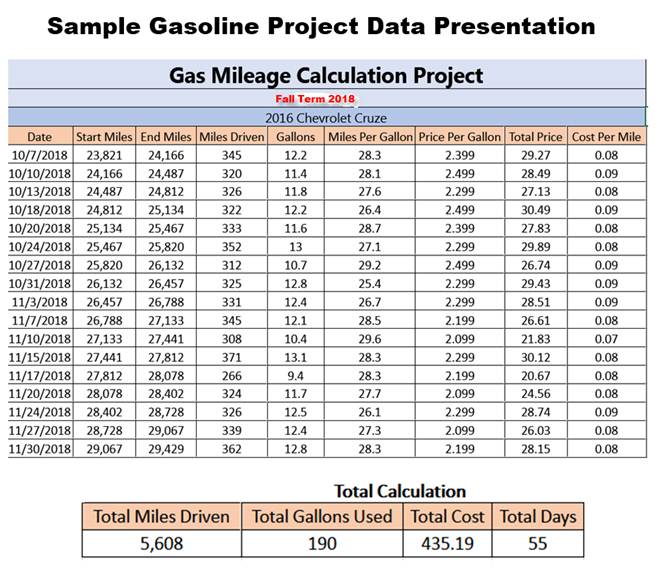
The student above did a nice job, good data collected,
good presentation (slightly different from what I outline) and the totals make
sense.
The student filled up every purchase (not necessary). But I have questions
about the first line. Did he/she start the project October 7 or before.
Did he/she use the initial fillup and cost in the total gallons and total
cost?
The student earned 40 points out of 50 as she/he did not due the projections
not the carbon dioxide emmissions.
Even though there is a question about the data he/she earned 40/40 for doing a
good job.
Second Sample Gasoline Project Fall 2018
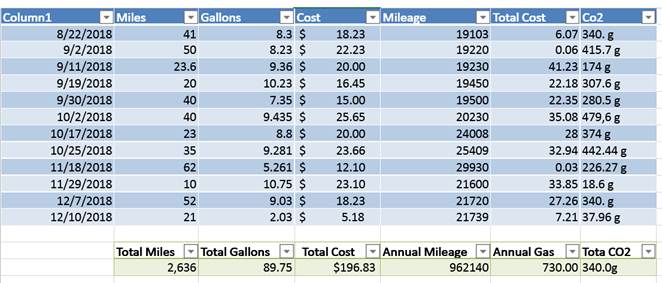
The above data just does not make sense. The student should have discussed
this data before sending in the final project.
The student earned 30 points for data collection; but lost 10 points for the
calculation and presentation.
The student earned 2 points out of 10 for the two projections. Total 32/50.
Third Sample Gasoline Project Fall 2018
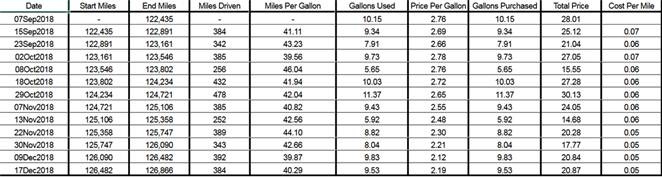
This third project is excellent, the data is
collected & presented.
The first line is not used in the totals.
The calculations and projects make sense.
Grade 50/50
My Throw Away Car vs my Hybrid
My concept of driving with the increase cost of gasoline many years ago, was to have a car which gets at least 20 miles per gallon; but spend approximately only 5 to 10 cents a mile on the cost of the vehicle. At $4 per gallon that is 20 cents per mile for gasoline to drive plus 10 cents purchase cost per mile. At $2.00 per gallon and 20 mpg, the cost is 10 cents per mile for gasoline. The federal government states that it cost the average tax payer 57 cents per mile to drive. But that also takes in the cost of insurance, repairs, tires, etc. To be happy I need to spend only 30 cents or less per mile for gasoline and cost of the car.
In 1985, I purchased second last brand new car. It was a GM Tech 4 engine which got 27-37 mpg. Before that it was1963 when I got my first brand new car which got 20 mpg car a VW Karman Ghia. My very first car was a 55 Ford coupe in 1958 which got only 8-10 mpg. (Gasoline then was 14 cents a gallon. I got upset in 1962 when gas jumped to 17-18 cents a gallon and so I went for the 20 mpg. Have a laugh, but think about it a 4 cent jump was almost a 30% increase. Today that equates to $3 to $3.90. Remember minimum wage in 1962 was 40 cents an hour, which was $16 per week for a worker trying to just get by.
All the cars in between have been used from excellent to tired old beat-up cars. Sometimes, I call them Throw Away Cars (Spend $1000 drive it 10,000 miles then throw it away: cost 10 cents per mile). (Put $1000 in repairs, then I had to get 20,000 miles before throwing it away)
Now what about hybrid vs total electric cars and the cost to operate?
If you do the math the cost of the vehicle outweighs the saving in buying gasoline. A year ago, gas was at an all-time low in January 2017 for the last 20 years at under $2.00, so the small savings will not out weight the cost of the car. But we have seen a yo-yo running out of energy. Gas goes up 20 cents; then drops 10; then it goes up 20 cents and drops back 10. Now with the economy dumping the price has fallen from $2.80 per gallon to as low as $1.95 just this week. Say you spend $30,000 on a good hybrid, drive it 125,000 miles and then sold it for say $5000. So, $25,000 was spent to drive 125,000 miles which is 20 cents per mile. My Prius bought new in 2012 now has 124,000+ miles at a cost of $30,000 and the gasoline is costing between 4 and 5 cents per mile…so I barely win cost wise but the environment wins big with better yearly consumption data.
In your projections and summary portion of this project I included some national data to explain we are using far less gasoline than in 2007-2008. In my six years, 80 months using the Prius, I have used approximately 2500 gallons of gasoline (or 500 gallons per year) versus 5500 gallons if I had continued to drive my previous car, a police interceptor Crown Vic (or 1125 gallons per year). So, I have done my part in helping the environment, while not exceeding my 30 cent per mile idea (and I am driving a newer car)
If electricity is 12 cents per kWh — the national average (JEA 14.5 cents/kwh) — it would cost $3.48 to go 100 miles. At 20 mpg and $2.00 per gallon, then it would cost $10 to go 100 mile with gasoline. Another way to calculate cost is to use the number of kilowatt-hours it takes to recharge the EV's battery. If an EV requires 20 kWh to fully recharge and the rate is 12 cents per kwh, that's $2.40 to fill up the car (Nov 19, 2013) (JEA Rate is currently 14.2 cents per kwh and we do not variable rates depending on the time of day.) However, do we save the environment from CO2? Do the research and find out how much CO2 is emitted in a fossil fuel electric plant (like JEA) to produce on KWH. There is a power plant who has installed CO2 scrubbers, but the system is turned off. Why?
I am very concerned about our environment. No matter how many mpg you get, every gallon of gasoline you burn produces almost 18.7 pounds of Carbon Dioxide into our atmosphere.
How much CO2 is generated to produce One KWH to charge the batteries of a pure electric car or a plug in hybrid? Is it more or less compared to burning one gallon of gasoline. Address this issue in your summary paper (Projections)
2012 Toyota Prius Sample Data (1st eight months)
Purchased car: May 1, 2012 Odometer 00004 full tank
Month One: May 2012
1st fill-up: Hess-Orange
Park 5/10/12
9.2 gallons $3.629 $33.25 odometer: 00389.4 42.7 mpg
2nd fillup: Gate-Dunn 5/17/12
8.6_gallons $3.49 $29.80 odometer: 772
3rd fillup-Shell @ Emerson
5/24/12
9.3 gallons $3.48 $32.25 Odometer 1142 371 miles 39.9 mpg
Gate-Dunn 5/29/12 fillup
2.66 gall0ons $3.389 $9.01 Odometer 1248
Gate-Dunn 5/31/12 fillup
3.25gallons ( $3.389) Odometer 1401 $11.00
BP-Ocala Return from Tampa 6/3/12
(not fil-up)
3.0 gallons $3.47 Odometer 1820 $10.00
Marathon-Ocala 6/3/12 (fillup)
6.7 gallons $3.239 $21.75 Odometer 1829
Total 42.7 gallons 1829 miles = 42.7 mpg
Total Spent $147.06 to date or 8.04 cents/mile
Crown Vic equivalence:
1829 miles divided by 20 = 91.49 gallons @ 3.44/gallon = $314.40
Saved $167.33 in month of May
Month Two: June 2012
Gate-Dunn 6/4/12
3.3 gallons $3.319 $10.90 1974 miles
Gate-Dunn 6/11/12
8.4 gallons $3.269 $27.51 2350 miles
Shell-Hodges 6/17/12
8.2 gallons $3.289 $27.00 2714
Gate-Dunn 6/26/12
8.9 gallons $3.179 $28.25 3107.5 miles
Gate-Dunn 7/2/12
3.2 Gallons $3.139 $10.00
Shell-Hodges 7/3/12
8.55 gallons $3.159 $27.01 3626.5
June Total 40.55 gallons 1797.5 miles = 44.33_ mpg $130.67 spent
2 Month Total 83.25 gallons 3625.5 miles = 43.54 mpg
Total Spent $ 277.73 to date or 7.66 cents/mile
Month Three: July 2012
Gate-Dunn 7/10/12
8.13 gallons $3.229 $26.25 3980.6
Shell-Hodges 7/17/12 lost ticket found
3/14
9.051 Gallons $3.259 $29.50 4364
Kangaroo Express 7/24/12
8.81 gallons $3.349 $29.58 4755
Gate-Dunn 7/26/12
3.07 gallons $3.339 $10.25 4867
Gate-Dunn 8/6/12
5.45 gallons $3.489 $19.02 5113f
New Total: 5113 miles
July Total 34.51 gallons 14.87.5 miles = 43.1 mpg $114.60 spent
3 Month Total 117.76 gallons 5113 miles = 43.4 mpg
Total Spent $393.33 to date or 7.67 cents/mile
Month
Four: August 2012
Shell-Emerson
8/12/12
8.891 gallons $3.599 $32.00 5500f
Shell-Hodges 8/25/12 missing ticket AMX estimate
E8.70 gallons E$3.639 $31.67 5844
Shell-Hodges 8/25/12
8.205 gallons $3.639 $29.86 6210
August Total E25.80 gallons E1097 miles = _____ mpg $93.53 Spent
4 Month Total ____ gallons xxxx miles = _____ mpg
Total Spent $________ to date or _______ cents/mile
Month Five: September 2012
Kangaroo 9/08/12
2.668 gallons $3.749 $10.00 6583
Shell-Emerson 9/12/12
9.059 gallons $3.699 $33.51 6688f
Gate-Dunn
9/17/12
3.973 Gallons $3.779 $15.01 7087 nf
Gate-Dunn
9/18/12
8.528 gallons $3.729 $31.80 7218 f
Gate-Dunn
9/21/12
6.157 gallons $3.679 $22.65 7478f
Kangaroo 9/29/12
4.415 gallons $3.629 $16.02
Sam’s
Club 9/29/12
5.271 gallons $3.559 $18.81 7899 f
September Total ____ gallons _______ miles = _____ mpg
5 Month Total ____ gallons 7899 miles = _____ mpg
Total Spent $________ to date or _______ cents/mile
Month Six: October 2012
Shell-Hodges
10/06/12
8.254 gallons $3.579 $29.54 8267 fr
Gate-Dunn
10/15/12
9.072 Gallons $3.639 $33.01 8657f
Shell-Emerson
10/19/12
7.288 gallons $3.499 $25.50 8977f
Shell-Emerson
10/24/12
7.590 gallons $3.399 $25.80 9311f
Hess-University
10/29/12
4.818 gallons $3.229 $15.56 9515f
October Total ____ gallons _______ miles = _____ mpg
6 Month Total ____ gallons 9515 miles = _____ mpg
Total Spent $________ to date or _______ cents/mile
Month Seven: November 2012
10,000 mile Service Coggan Toyota
11/2 Oil Change Pennzoil 0-20W Synthetic Tires Rotated
Sam’s
Club 11/09/12
9.382 gallons $3.199 $30.01 10,244 f
Shell-Hodges
11/15/12
7.869 gallons $3.179 $25.02 10,590f
11/26/12
Gate-Dunn No f
4.590 gallons $3.269 $15.00 10,982 nf
11/29/12
Gate-Dunn f
9.401 gallons $3.249 $30.54 11208f
November Total ____ gallons 11208 miles = _____ mpg
Grand Total ________ gallons ___________ miles = ________ mpg
Total Spent $________ to date or _______ cents/mile
Month Eight December 2012
12/3/12
Gate Dunn F
7.725 gallons $3.239 $25.02 11541
12/06/12
Shell-University F
6.601 gallons $3.249 $21.45 11840f
12/11/12
Gate Dunn f
9.415 gallons $3.189 $30.02 12261
12/15/12
Sam’s Club-Beach f
6.921 gallons $3.109 $21.52 12,572
12/30/12
Shell-West Palm Cruise almost F
9.013 gallons $3.439 $31.00 12,951
12/31/12
Sam’s Club Beach f
8.933 gallons $3.359 $30.01 13,282
December Total ____ gallons _______ miles = _____ mpg
Grand Total ________ gallons ___________ miles = ________ mpg
Total Spent $________ to date or _______ cents/mile
Three Years Later:
Month
45 January 2016
1/8/16
Shell-Hodges Debit
9.294 Gallons $1.829 $17.00 82855 fill
1/14/16
Shell-Hodges Visa
9.292 Gallons $1.749 $16.25 83287 fill
1/18/16
Shell-Beach AMX
6.015 Gallons $1.729 $10.40 xxx fill
1/21
/16 Shell-Hodges VISA no receipt
9.170 Gallons $1.669 $15.30 83901 fill
Trip to Holiday Jan 22-23
1/23/14 Marathon/I75-Ocalla VISA
4.171Gallons $1.799 $7.50 no fill
1/25/16
Shell Hodges Visa
8.591 Gallons $1.659 $14.25 84436 fill
1/30/16
Shell Hodges AMEX
6.088 Gallons $1.659 $10.10 84710 fill
January 2016 Total ____ gallons _______ miles = _____ mpg
Grand Total ________ gallons ___________ miles = ________ mpg
Total Spent $________ to date or _______ cents/mile
Month 46 February 2016
2/1/16
Shell Hodges AMEX
5.757 Gallons $1.659 $9.55 84976 fill
2/6/16
Shell Hodges AMEX
4.940 Gallons $1.649 $8.15 85209 fill
2/10/16
Shell Hodges AMEX
9.391 Gallons $1.619 $15.20 85629 fill
2/13/16
Speedway-Port Richey-fill AMX
9.391 Gallons $1.629E $15.30 XXXXX fill
2/14/16
Racetrac-Brooksville-amx
xxxx Gallons $1.999 $4.78 no fill lost ticket
2/16 /16 Shell Hodges-AMEX (missing Ticket)
9.037 Gallons $1.599 $14.45 86474
2/19/16
Shell-Hodges-AMEX
4.414 Gallons $1.699 $7.50 fill 86688
2/27/16
Shell-Hodges-AMEX
9.528 gallons $1.669 $15.90 fill 87111
February 2016 Total ____ gallons _______ miles = _____ mpg
Grand Total ________ gallons ___________ miles = ________ mpg
Total Spent $________ to date or _______ cents/mile
Month 47 March 2016
3/4/16
Shell Hodges AMEX
9.310 Gallons $1.799 $16.75 87544 fill
3/7/16
Shell Hodges AMEX
9.141 Gallons $1.789 $16.35 87942 fill
3/9/16
Shell Hodges AMEX
8.222 Gallons $1.849 $15.20 88304 fill
3/17/16
Shell Hodges AMEX
9.204 Gallons $1.999 $18.40 88718 fill
3/28/16
Mobile Ft Lauderdale AMX
9.434 Gallons $2.199 $20.75 89111 fill
3/29/16
Gate-Dunn AMX
5.102 Gallons $1.989 $10.15 no fill
3/31/16
Gate-Dunn
9.504 Gallons $1.989 $18.90 89,730 fill
March 2016 Total ____ gallons _______ miles = _____ mpg
Grand Total ________ gallons ___________ miles = ________ mpg
Total Spent $________ to date or _______ cents/mile
Month 48 April 2016
4/5
/16 Shell Beach AMX
9.391 Gallons $1.959 $18.40 90,129 fill
Keith
Pierson Toyota
90,000 mile service; alignment; air filters(cabin) $234.27
4/9/2016
Shell Hodges AMX
8.691 Gallons $1.899 $16.50 90,526
4/15/16
Shell Hodges AMX
8.768 Gallons$1.899 $16.65 90,915
4/21/16
Shell-Hodges AMX
8.897 Gallons $1.899 $16.90 91,323
4/28/16
Shell-Hodges AMX new
9.450 Gallons $2.159 $20.40 91,749
April 2016 Total ____ gallons _______ miles = _____ mpg
Grand Total ________ gallons ___________ miles = ________ mpg
Total Spent $________ to date or _______ cents/mile
Month 49 May 2016
5/15/16
Shell-Beach/St Johns AMX new
8,527 Gallons $2.099 $17.90 92,114 fill
M ay 2016 Total ____ gallons _______ miles = _____ mpg
Grand Total ________ gallons ___________ miles = ________ mpg
Total Spent $________ to date or _______ cents/mile
Month 50 June 2016
6/
7/16 Gate Dunn AMX-New
4,392 Gallons $2.289 $10.05 xxxx no fill
6/12/16
Shell-Hodges AMX new
9.395 Gallons $2.289 $21.51 92,712 fill
6/20/16
Shell Beach/St johns AMX-new
9.307 Gallons $2.149 $20.00 fill 93,083
June 2016 Total ____ gallons _______ miles = _____ mpg
Grand Total ________ gallons ___________ miles = ________ mpg
Total Spent $________ to date or _______ cents/mile
2004 Volvo S80 Twin Turbo T6 Chris’s Car
March 2016 Purchased Car
3/?/16
Phillips Hwy 93 octane Visa new (no ticket in log book)
18.406 Gallons $2.499 $x.xx 109,400 fill (initial fillup of used car)
3/25/16
Circle K-Shell Tarpon Springs 93 octane Visa new
16.604 Gallons $2.499 $41.00 109,743 fill
4/14 /16 Car ideal 2 hrs at auction; 6 gal to get back to Jax?
4/08/16Circle
K-Shell Tarpon Springs 93 octane VISA-new
19.112 Gallons $2.459 $47.00 110,665 fill-up
4/12/16
Shell-Gainesville 87 octane VISA new
17.972 Gallons $2.059 $37.22 111,072 fillup
4/16/16
Shell-Beach 93 octane VISA new
18,118 Gallons $2.539 $46.00 111,467 fill-up
1 week at body shop
4/28/16
Shell-Beach 93 octane VISA new
14.668 Gallons $2.659 $39.00 111,756 fill-up
April 2016 Total ____ gallons _______ miles = _____ mpg
Grand Total ________ gallons ___________ miles = ________ mpg
Total Spent $________ to date or _______ cents/mile
Data from May 2016 to present needs to be
added here

Students needing a project (just 10 points as I collected the data):
- you must complete the remaining calculations for each month from May 2012 through July 2016.
- You must complete the monthly data calculation for son’s Volvo.
- There are missing or incomplete tickets, which must be estimated (I will help you wiuth this)
- Revise or add a revision Months 1-6 to show monthly data in addition the grand total
- Revise months 7-12; 13-18; 19-24; 25-30; 31-36; 37-42 to add total miles to date; total gallons; overall mpg
- Estimate equivalent cost; equivalent
gallons used for the Prius versus
the Crown Vic assuming same miles driven by Crown Vic—at 20 mph). - Show a yearly total for each of the three years with all the data collected and estimated and the current 4th year
- Compare CO2 levels actually produced from new car versus old car Crown Vic
- Do the estimates requested in the project for the 4 year total instead of one term.