Critical
Thinking Exercise
By definition:
Learning - the acquisition of knowledge or skill.
Teaching – the action of a person who is showing or helping a person to learn.
Cognitive scientist define “critical
thinking” as mental activity associated with these types of thinking:
a. applying reasoning
b. making decisions
c. problem solving
At FSCJ we have been addressing “Institutional Effectiveness”(I.E) across the curriculum. The faculty is developing district wide exercises to assess learning outcomes. For chemistry (CHM 1020) the science council/cluster feels we need to pursue under our course goals and objectives the following outcomes:
FSCJ CHM 1020 Official
Learning Outcomes:
1. Explain and apply major concepts in general
chemistry
2.
Demonstrate
knowledge of scientific method
3.
Interpret scientific models such as formulas, graphs, tables
and schematics, draw inferences from
them and recognize their limitations.
4.
Demonstrate problem solving methods
in situations that are encountered outside of the classroom
Temperature is a measure of the AVERAGE amount of energy in a substance not the total energy.
HEAT is the energy that flows from a higher temperature object to a lower temperature object.
Cold is the absence of HEAT.
Absolute Zero –Temperature at which the particles of a substance have absolutely no kinetic energy to give up.
The following exercise addresses all four of the above learning outcomes, especially #3:
Assignment:
Read section 2.6: Temperature Is Measure of How Hot
– Heat It is Not!
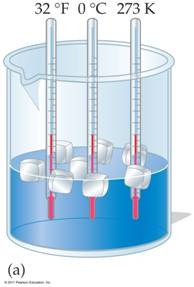
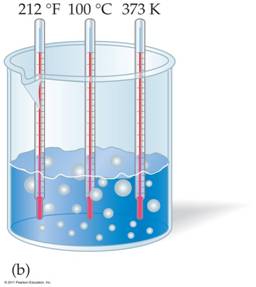
The above images demonstrate equivalent temperatures on the Fahrenheit and Celsius scales with ice water and boiling water. The third thermometer compares to Kelvin Temperatures to Fahrenheit and Celsius temperatures.
Go to the temperature conversion web site:
http://www.lsua.info/mathworkshop1/frametemp2.html
- Setup the Student’s theoretical temperature scale with the following parameters:
- The Freezing
Point of water is Your Age
or Your desired Age. (Prof Taylor 50oT)(Ms Sweet 30oS)
- The Boiling
Point of water is your body
weight or desired body weight (Prof Taylor 250oT)(Sweet
120oS)
- Fill in the table below/next
page with your parameters to make oX
(Student): (Professor Taylor’s normal body temperature is the normal 98.6 oF, Professor Bessman
96.8 oF, and Ms Sweet 97.3 oF.
- If your
normal body temperature is not 98.6 then fill in you Fahrenheit
temperature and calculate the blanks across the line of the table.)) at
least 5 points from +250oF to -150oF
Table
of Equivalent Temperatures:
|
Temperature oF |
Temp.
oC |
Temp.
K |
Temp.
oT |
Temp.
oS |
Temp.
oX |
|
(Fahrenheit) |
(Celsius) |
(Kevin) |
(Taylor) |
(Sweet) |
(Student) |
|
250 |
121 |
394 |
298 |
139.0 |
|
|
212 |
100 |
373 |
250 |
120.0 |
|
|
158 |
70 |
343 |
190 |
93.0 |
|
|
104 |
40 |
313 |
130 |
66.0 |
|
|
|
|
|
|
|
|
|
98.6 |
37.0 |
310.0 |
124.0 |
63.3 |
|
|
|
|
|
|
|
|
|
97.3 |
36.3 |
309.3 |
122.6 |
62.7 |
|
|
|
|
|
|
|
|
|
96.8 |
36.0 |
309.0 |
122 |
62.4 |
|
|
81 |
27 |
300 |
104 |
54.5 |
|
|
77 |
25 |
298 |
100 |
52.5 |
|
|
75 |
24 |
297 |
98 |
51.5 |
|
|
68 |
20 |
293 |
90 |
48.0 |
|
|
50 |
10 |
283 |
70 |
39.0 |
|
|
32 |
0 |
273 |
50 |
30.0 |
|
|
14 |
-10 |
263 |
10 |
21.0 |
|
|
0 |
-18 |
255 |
1 |
14.0 |
|
|
-4 |
-20 |
253 |
-2 |
12.0 |
|
|
-22 |
-30 |
243 |
-14 |
3.0 |
|
|
-28 |
-33.3 |
240 |
-17 |
0.0 |
|
|
-40 |
-40 |
233 |
-26 |
-6.0 |
|
|
-58 |
-50 |
223 |
-33 |
-15.0 |
|
|
-76 |
-60 |
213 |
-50 |
-24.0 |
|
|
-130 |
-90 |
183 |
-86 |
-51.0 |
|
|
-148 |
-100 |
173 |
-98 |
-60.0 |
|
- Using a rectangular piece
of graph paper, set up a graph plotting Fahrenheit versus Celsius so that
vertical axis is Fahrenheit ranging from 250 down to -150 and the
horizontal axis is -100 on the left and 125 on the right.
a. Describe the line or curve generated by this data:
b. If the plot is a line, then what is the slope of the line and the Y intercept and the X intercept.
c. Write the equation
for the line.(Do you remember the equation of a straight line from
algebra?)
d. If the plot is a curve, can you write the equation of the curve?
- Now plot Celsius versus Kelvin on a rectangular coordinate graph. If Kelvin is the y axis and Celsius is the x axis,
- what is the y axis intercept? What is the slope of the line?
- Is there an easier way to find the slope of the line by looking at the data?
- At what temperature Celsius would kelvin equal zero?
In the Suchocki textbook on page 40 Figure 2.21 refers to temperature on the Fahrenheit and Celsius scales as degree F (oF) and degree C (oC), but in kelvin temperature, temperatures are referred as kelvin units not have the degree o symbol before the K. Why?
8. Now plot Celsius versus Student and Fahrenheit versus